| (11 intermediate revisions by the same user not shown) | |||
| Line 1: | Line 1: | ||
| − | The | + | __FORCETOC__ |
| − | + | ===Overview === | |
| + | [[File:스크린샷 2023-08-09 오후 5.17.29.png|300px|thumb|dashboard-config]] | ||
| + | The dashboard consists of RADIUS and DHCP, and automatically switches every 30 seconds. Double-clicking one of the buttons at the top creates a pin icon, which freezes the screen. In the RADIUS dashboard, the status of all imRAD N1 systems are also displayed. | ||
| − | + | The | |
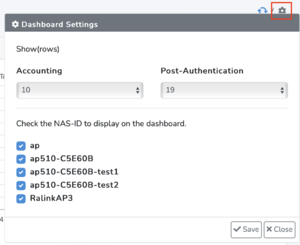
| − | + | [[File:스크린샷 2023-08-09 오후 5.18.38.png|25px]] icon in the upper-right corner of the dashboard allows you to on/off automatic refresh by clicking it. The [[File:스크린샷 2023-08-09 오후 5.19.00.png|25px|config-icon]] icon, as shown in the image on the right, allows you to configure what is displayed in the RADIUS dashboard. Accounting and authentication processing represent the number of columns displayed on the dashboard, and selecting an NAS-ID will only display information from the selected NAS-ID on the dashboard. | |
| − | The | ||
| − | ====== | + | === RADIUS === |
| − | + | [[File:MicrosoftTeams-image (1).png|800px|dashboard-radius]] | |
| − | The | + | ==== System Status ==== |
| + | [[File:스크린샷 2023-08-09 오후 5.38.43.png|200px|thumb|dashboard-system-status]] | ||
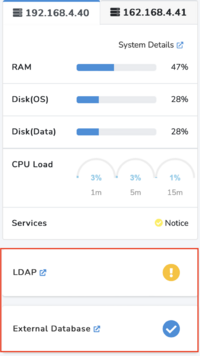
| + | The top-left corner of the RADIUS dashboard displays the system's memory (RAM), disk, and CPU load. Clicking on "System Details ([[File:스크린샷 2023-08-09 오후 5.42.31.png|110px|goto-sys-details]])" takes you to the detailed page. The "Services" section displays "Normal" if all operational services are running, and it shows "Warning" if one or more services are in a stopped state. | ||
| − | + | If external authentication servers, such as an "LDAP server" or an "external database," exist, the connection status of LDAP and external database servers are shown on the left in RADIUS dashboard. | |
| − | |||
| − | |||
| − | |||
| − | |||
| − | |||
| − | + | The [[File:스크린샷 2023-08-09 오후 5.41.39.png|20px|exdb-ok]] icon indicates all connections are normal and the [[File:스크린샷 2023-08-09 오후 5.41.29.png|20px|exdb-notok]] indicates warning. "Warning" signifies that there are connection problems with external servers. | |
| − | |||
| − | |||
| − | ==== | + | ==== Hourly Counts of Post-Authentication ==== |
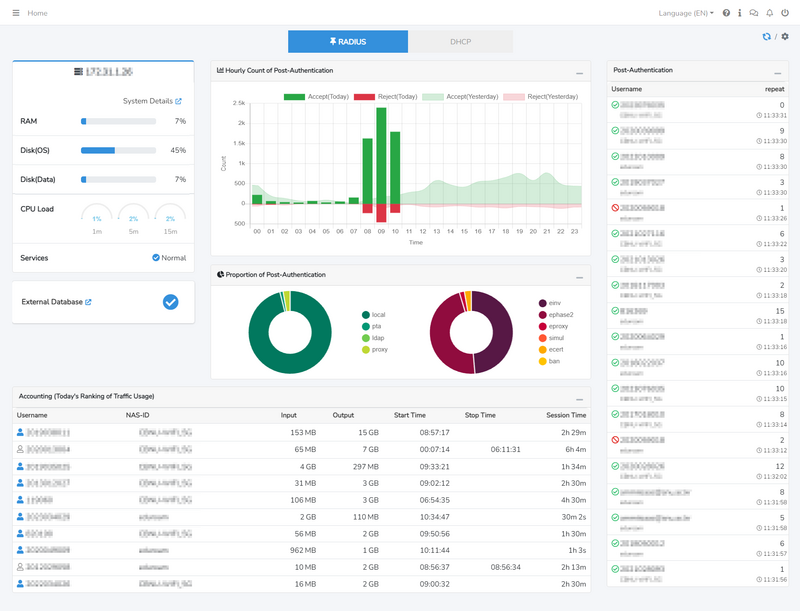
| − | + | This represents the number of users authenticated or not per hour. Green bars represent Access-Accept, while red bars represent Access-Reject. The bars represent today's counts, and the line represents yesterday's counts. | |
| − | |||
| − | The | ||
| − | |||
| − | + | ==== Proportion of Post-Authentication ==== | |
| + | This indicates the ratio of users who were processed with Access-Accept (green pie chart) and Access-Reject (red pie chart). | ||
| − | + | * Access-Accept | |
| − | + | ** local: Authenticated through the Local database | |
| − | * | + | ** pta: Authenticated through an external database |
| − | * | + | ** ldap: Authenticated through an external LDAP |
| − | * | + | ** proxy: Authenticated through an Proxy server (authenticated through an external authority) |
| − | + | * Access-Reject | |
| + | ** einv: User-Name or User-Password is incorrect | ||
| + | ** epahase2: Attempted phase-2 authentication using MSCHAPV2 in the Android environment. LDAP, external database, or Proxy server can't authenticate MSCHAPV2 password. | ||
| + | ** simul: Exceeded simultaneous connection limit | ||
| + | ** ecert: Client certificate error | ||
| + | ** ban: Authentication denied by reject2ban | ||
| − | ==== | + | ==== Post-Authentication ==== |
| − | + | Displays users who have been authenticated or not in real-time. A red icon preceding the username indicates Access-Reject. Clicking on the username provides detailed information. | |
| − | + | ==== Accounting (Today's Ranking of Traffic Usage) ==== | |
| + | This information displays the ranking of users who have used the most data among those connected to the network after successful authentication. | ||
| + | |||
| + | |||
| + | === DHCP === | ||
| + | [[File:MicrosoftTeams-image.png|800px|dashboard-dhcp]] | ||
| + | ==== DHCP HPM (Hits per Minute) / LPM (Leases per Minute) ==== | ||
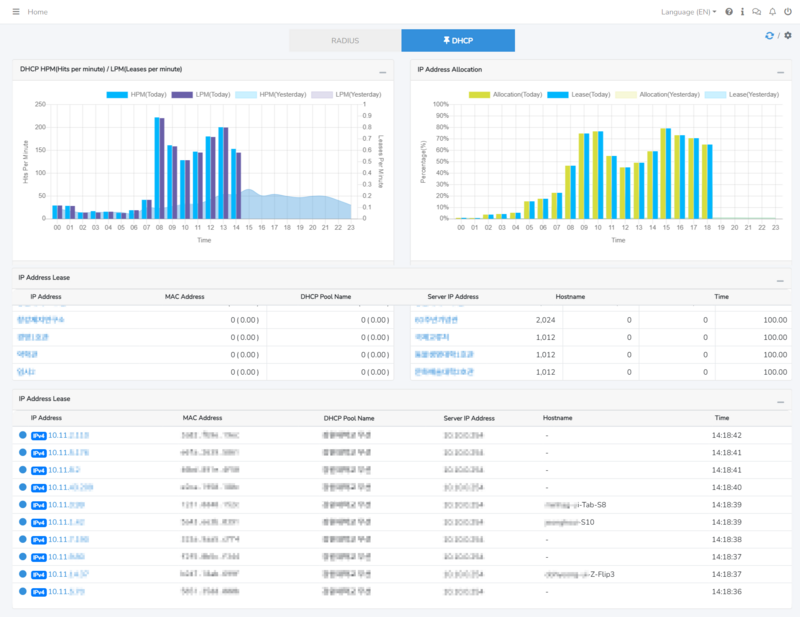
| + | HPM indicates how many requests were received from clients to the server, while LPM signifies how many leases were generated from these requests. | ||
| + | The number of LPM is always less than or equal to the number of HPM, and the percentage is shown relative to the total HPM or LPM. | ||
| + | If HPM significantly exceeds LPM, it means there is no pool containing IP addresses to allocate for the client's requests. Please review the DHCP history to ascertain if the required DHCP pool is needed. | ||
| + | |||
| + | ==== DHCP Address Allocation ==== | ||
| + | Displays the distribution of IP address allocation over time for the entire DHCP range, showing leases and allocation rates. The lease rate is always less than or equal to the allocation rate. | ||
| + | |||
| + | ==== IP Address Leases ==== | ||
| + | Shows the real-time status of current leases, expirations, releases, and denials. Clicking on an IP address provides detailed information. | ||
Latest revision as of 18:38, 9 August 2023
Overview
The dashboard consists of RADIUS and DHCP, and automatically switches every 30 seconds. Double-clicking one of the buttons at the top creates a pin icon, which freezes the screen. In the RADIUS dashboard, the status of all imRAD N1 systems are also displayed.
The
![]() icon in the upper-right corner of the dashboard allows you to on/off automatic refresh by clicking it. The
icon in the upper-right corner of the dashboard allows you to on/off automatic refresh by clicking it. The ![]() icon, as shown in the image on the right, allows you to configure what is displayed in the RADIUS dashboard. Accounting and authentication processing represent the number of columns displayed on the dashboard, and selecting an NAS-ID will only display information from the selected NAS-ID on the dashboard.
icon, as shown in the image on the right, allows you to configure what is displayed in the RADIUS dashboard. Accounting and authentication processing represent the number of columns displayed on the dashboard, and selecting an NAS-ID will only display information from the selected NAS-ID on the dashboard.
RADIUS
System Status
The top-left corner of the RADIUS dashboard displays the system's memory (RAM), disk, and CPU load. Clicking on "System Details (![]() )" takes you to the detailed page. The "Services" section displays "Normal" if all operational services are running, and it shows "Warning" if one or more services are in a stopped state.
)" takes you to the detailed page. The "Services" section displays "Normal" if all operational services are running, and it shows "Warning" if one or more services are in a stopped state.
If external authentication servers, such as an "LDAP server" or an "external database," exist, the connection status of LDAP and external database servers are shown on the left in RADIUS dashboard.
The ![]() icon indicates all connections are normal and the
icon indicates all connections are normal and the ![]() indicates warning. "Warning" signifies that there are connection problems with external servers.
indicates warning. "Warning" signifies that there are connection problems with external servers.
Hourly Counts of Post-Authentication
This represents the number of users authenticated or not per hour. Green bars represent Access-Accept, while red bars represent Access-Reject. The bars represent today's counts, and the line represents yesterday's counts.
Proportion of Post-Authentication
This indicates the ratio of users who were processed with Access-Accept (green pie chart) and Access-Reject (red pie chart).
- Access-Accept
- local: Authenticated through the Local database
- pta: Authenticated through an external database
- ldap: Authenticated through an external LDAP
- proxy: Authenticated through an Proxy server (authenticated through an external authority)
- Access-Reject
- einv: User-Name or User-Password is incorrect
- epahase2: Attempted phase-2 authentication using MSCHAPV2 in the Android environment. LDAP, external database, or Proxy server can't authenticate MSCHAPV2 password.
- simul: Exceeded simultaneous connection limit
- ecert: Client certificate error
- ban: Authentication denied by reject2ban
Post-Authentication
Displays users who have been authenticated or not in real-time. A red icon preceding the username indicates Access-Reject. Clicking on the username provides detailed information.
Accounting (Today's Ranking of Traffic Usage)
This information displays the ranking of users who have used the most data among those connected to the network after successful authentication.
DHCP
DHCP HPM (Hits per Minute) / LPM (Leases per Minute)
HPM indicates how many requests were received from clients to the server, while LPM signifies how many leases were generated from these requests. The number of LPM is always less than or equal to the number of HPM, and the percentage is shown relative to the total HPM or LPM. If HPM significantly exceeds LPM, it means there is no pool containing IP addresses to allocate for the client's requests. Please review the DHCP history to ascertain if the required DHCP pool is needed.
DHCP Address Allocation
Displays the distribution of IP address allocation over time for the entire DHCP range, showing leases and allocation rates. The lease rate is always less than or equal to the allocation rate.
IP Address Leases
Shows the real-time status of current leases, expirations, releases, and denials. Clicking on an IP address provides detailed information.


